Case Study /
Container xChange: Performance Metrics
Designing objective trust signals and operational risk profiles for a global container marketplace
Product Design /B2B Marketplace /Data Visualization
Only 32% of suppliers trusted the risk information on Container xChange. As lead designer on the platform squad, I designed a performance metrics system that replaced subjective star ratings with 11 objective operational signals, contributing to a 40% increase in marketplace transactions over six months.
Context & Challenge
Company Context
Container xChange is an online marketplace for leasing and trading shipping containers. A Series B logistics startup with a global customer base ranging from independent container traders to global shipping liners. The platform spans several business units: Marketplaces (leasing and trading), Insurance, Wallet, Ocean Freight, and Insights. The Platform squad owned shared infrastructure including company profiles, with the explicit mission: “Create trustworthy relationships between parties on xChange to enable secure transactions.”
The Problem
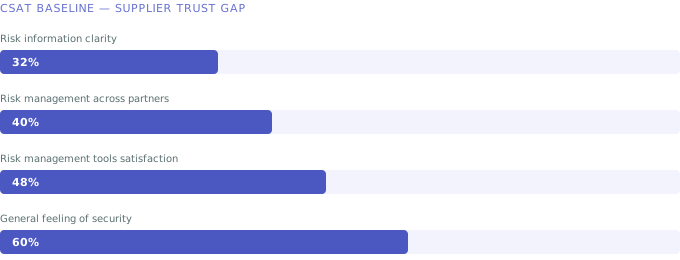
The marketplace faced a fundamental trust and risk transparency challenge. In the preceding quarter, platform data revealed that 30 to 40% of top suppliers had experienced default or dispute recovery cases. A customer satisfaction survey of 25 key suppliers measured the trust deficit: only 32% were satisfied with risk information clarity, and 40% felt the platform helped them evaluate counterparty risk.
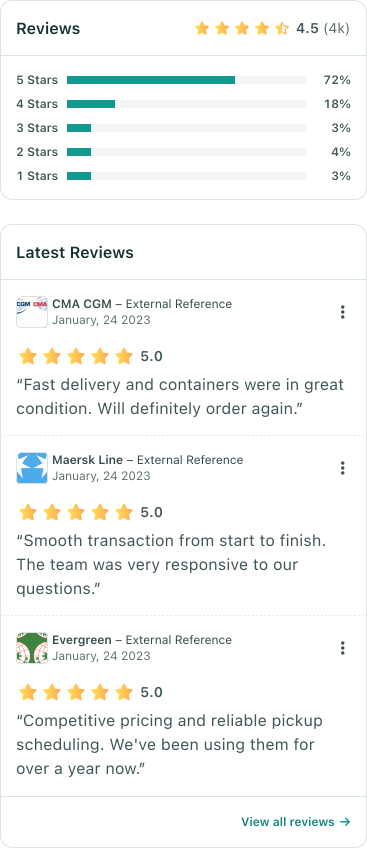
Suppliers needed to assess partner reliability before accepting deals, but profiles provided almost no objective transaction data. The only available indicator was a star rating derived from self-submitted references, which lacked credibility for high-value logistics transactions involving physical assets and financial liabilities.
Operational discrepancies produced frequent transaction friction: delayed payments, slow container releases, elevated deal cancellations, and unreturned equipment. These bottlenecks generated transaction fatigue among reliable suppliers who repeatedly matched with unvetted partners.
The platform also carried an unsustainable perception liability: many participants assumed xChange insured every transaction directly. The business required a clear transition: shifting from an intermediary perceived as liable for trade disputes to a neutral platform providing transparent risk data.
The strategic thesis was direct: publishing clear operational and financial metrics would enable suppliers to evaluate partner risk independently, reducing disputes and expanding transaction volume.
Challenges
- Absence of objective operational metrics beyond self-reported star ratings
- Low trust baseline: only 32% supplier satisfaction regarding risk clarity
- High dispute incidence: 30 to 40% of top suppliers had encountered default or recovery cases
- Misaligned user expectations that xChange insured all marketplace transactions directly
- Multiple operational vectors (payment timelines, release speeds, equipment damage) requiring synthesis into scannable indicators
- Risk calibration: avoiding overly punitive distributions that could depress marketplace liquidity
- Divergent transaction mechanics between leasing and trading workflows
- Potential partner pushback regarding the public display of negative performance metrics
Goals
- Provide objective, data-driven signals to evaluate partner reliability before closing deals
- Surface operational performance transparently to motivate self-directed supplier improvements
- Reposition xChange from an assumed transaction guarantor to a neutral risk data platform
- Increase transaction confidence and marketplace volume across leasing operations
- Establish an extensible metrics framework supporting multiple transaction types
Success Metrics
Success criteria centered on measurable improvements in supplier CSAT regarding risk transparency (targeting significant lift above the 32% baseline), positive behavioral adjustments from underperforming suppliers, and an overall increase in closed marketplace deals.
Discovery & Research
Research Methods
Discovery began from account management and risk operations data. Account managers handled daily escalations from suppliers facing deal defaults, while the risk operations team monitored dispute patterns and calculation models. The baseline CSAT survey of 25 suppliers provided quantitative validation of the trust deficit.
I partnered directly with account management and risk operations to map operational risk categories against database entities. We ran iterative workshops to define which operational behaviors were most predictive of transaction failure, determining specific mathematical formulas for release speed, payment timing, and equipment returns.
Key Findings
Finding 1: Subjective Reviews Failed to Inform Risk. Self-submitted reference reviews provided no predictive value for logistics risk. The 32% CSAT score confirmed that users required objective data calculated directly from platform transactions.
Finding 2: Operational Performance is Multi-Dimensional. A supplier could maintain flawless payment records while exhibiting chronic delays in container release. Single composite scores obscured critical distinctions. Evaluation required separate tracking across payments, operational execution, equipment handling, and communication speed.
Finding 3: Transaction Volumes Varied Widely. Sparse transaction histories required clear calculation thresholds: overall risk ratings activated after 3 completed transactions in 6 months, while detailed performance metrics required 5 completed deals.
Finding 4: Calibration Required Live Database Testing. We modeled calculations against the entire company database to verify distribution tiers. Testing confirmed that the vast majority of active suppliers landed in moderate to low risk bands, ensuring the system supported marketplace liquidity.
Finding 5: Partner Acceptance Depended on Advance Notice. Displaying objective metrics carried risk of partner dissatisfaction. The rollout required advance notifications, giving underperforming companies a clear window to resolve disputes before scores became public.
Competitive Analysis
I evaluated reputation systems across e-commerce and classifieds platforms. Consumer-focused star ratings (such as Trustpilot) proved too generalized for industrial B2B operations. Multi-tier classifieds ratings (Kleinanzeigen) offered better categorization models. We used these patterns to design a specialized framework tailored to physical container logistics.
Design Process
Strategic Direction
The design strategy aligned product patterns with business positioning. At the interface level, the system translated raw database timestamps into immediate visual ratings that required zero manual calculation. At the business level, it established xChange as a transparent data provider rather than a dispute mediator.
The interface operated across two touchpoints: detailed performance widgets on company profiles and scannable trust badges directly within marketplace search results.
Exploration & Ideation
Initial explorations tested abstract numerical scores from 1 to 5 with progress bars. User feedback showed that raw numerical averages created ambiguity: a score of 3.2 in release speed required suppliers to calculate what constituted an acceptable industry threshold.
I also explored color treatments for low-scoring tiers. To prevent alarmism while maintaining transparency, we established a balanced four-tier palette that flagged operational risk objectively without punitive visual styling.
Design Decisions
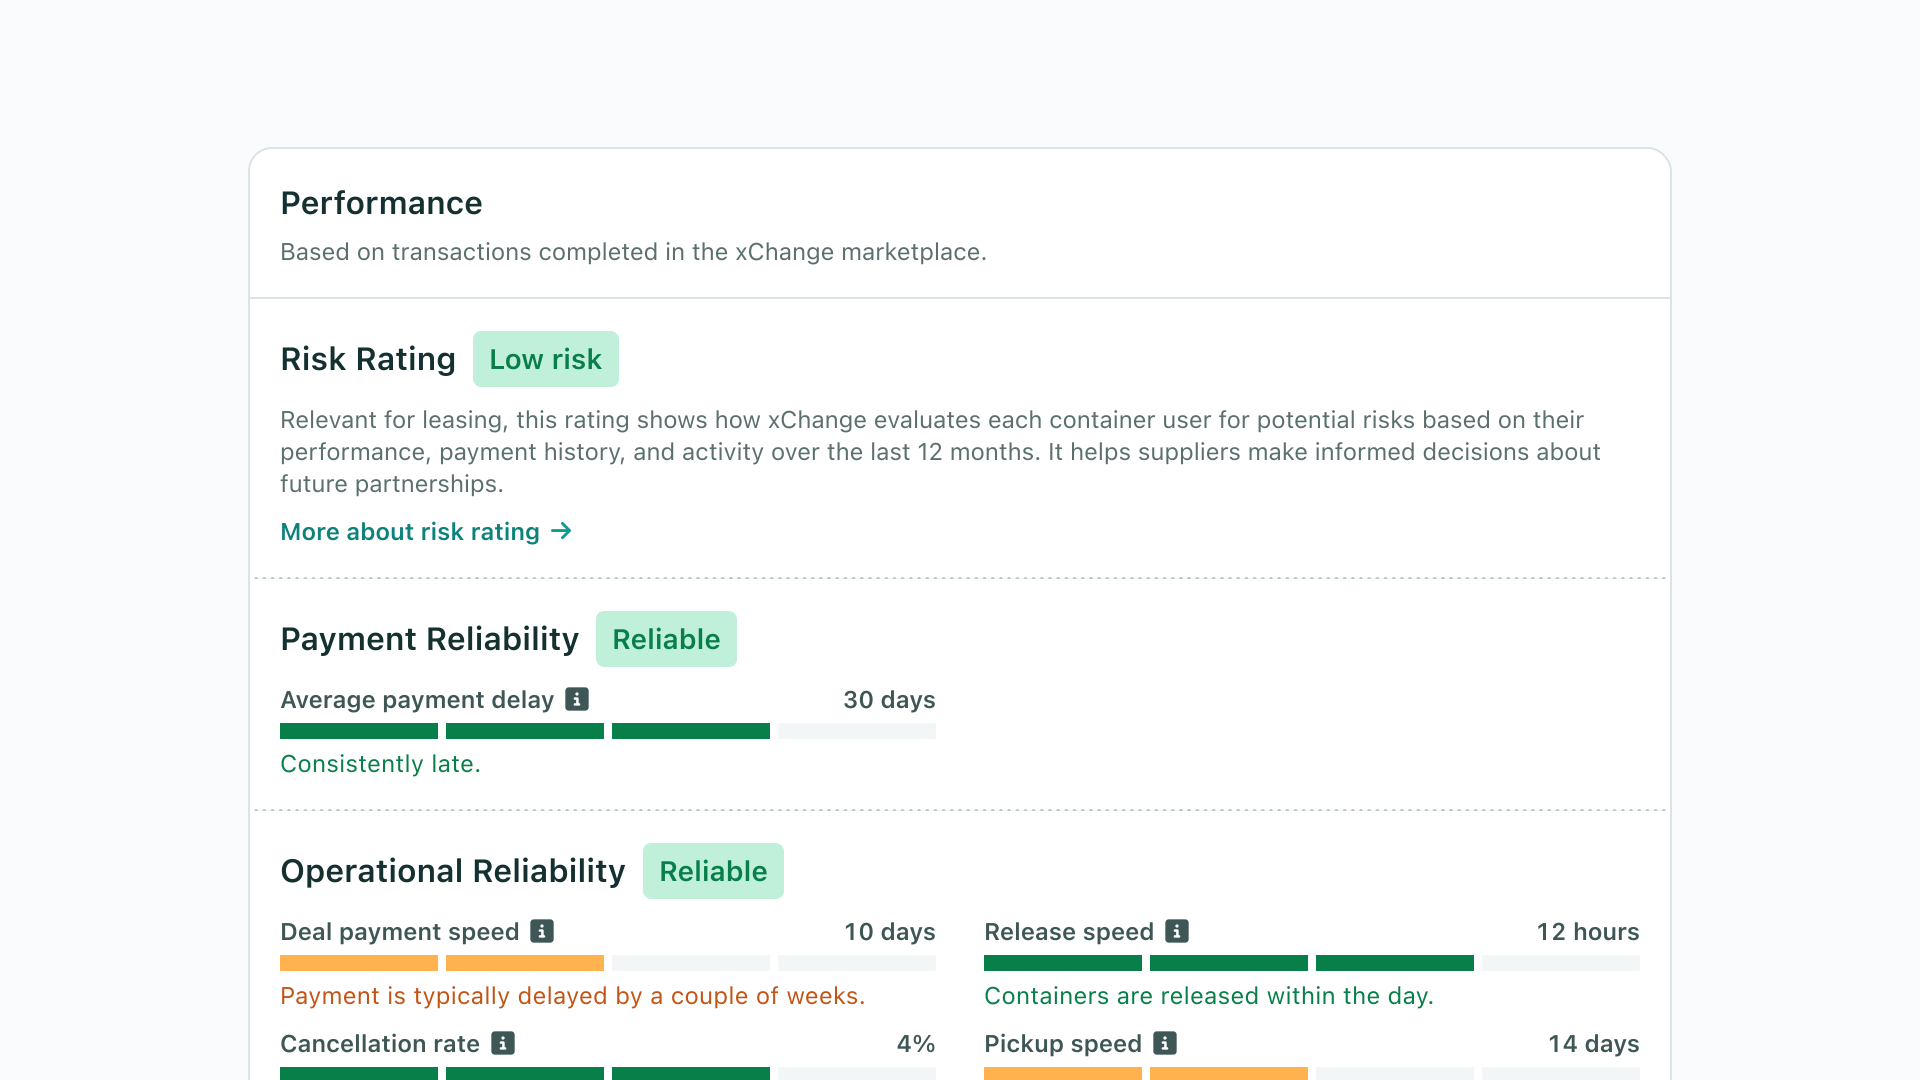
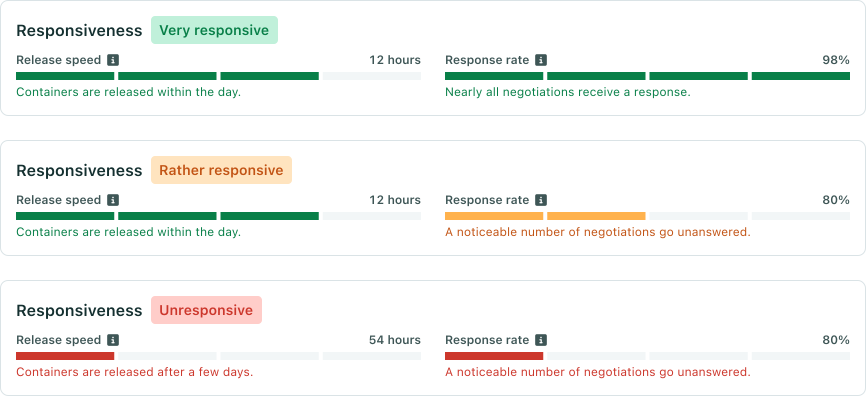
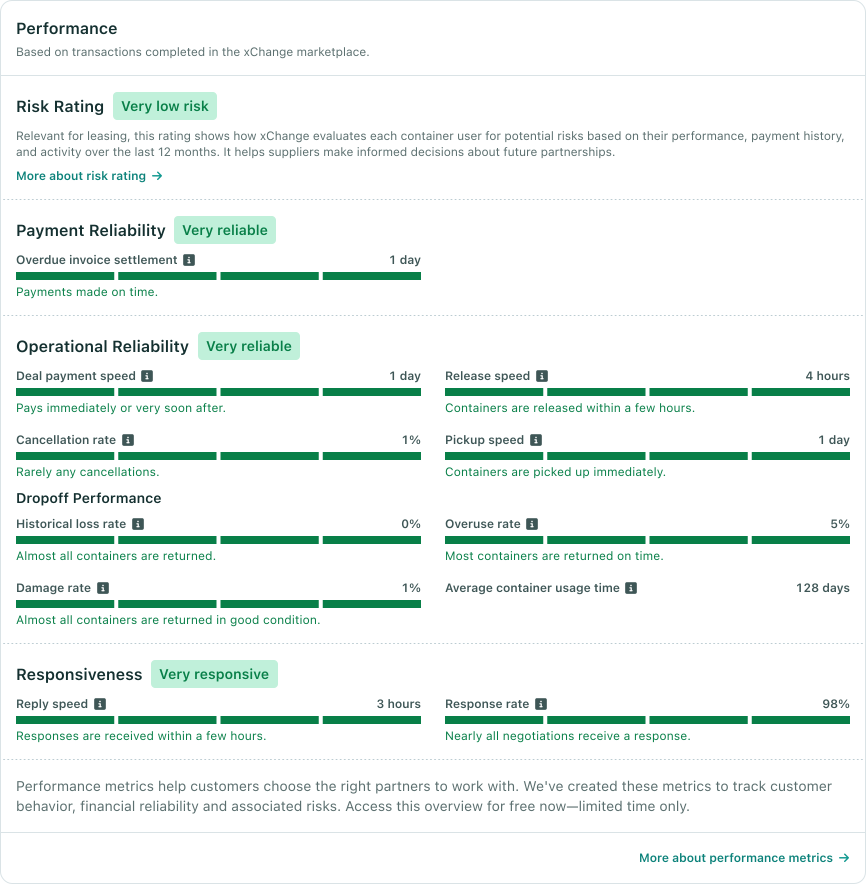
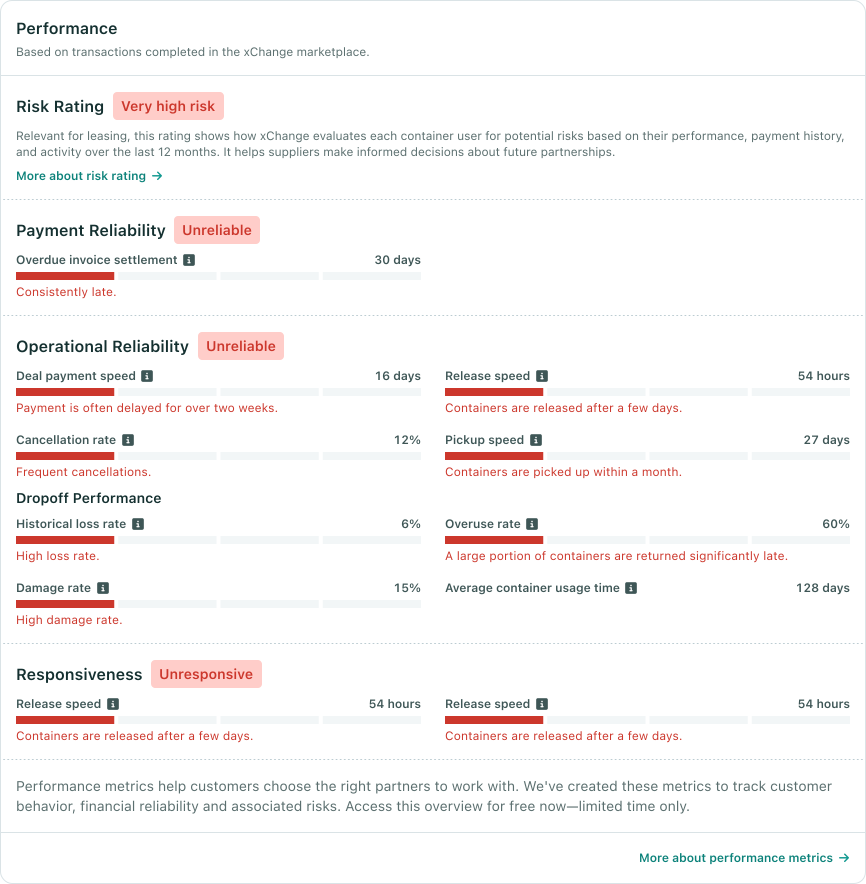
Decision 1: Segmented Bar Visualization with Contextual Labels I implemented a segmented bar visualization featuring four color-coded tiers (green, light green, orange, red) alongside a distinct grey state for insufficient data. Each metric couples an exact measurement (e.g. “3 hours”, “1%”, “4 days”) with a segmented bar and a plain-language summary label (e.g. “Containers picked up promptly”, “Frequent cancellations”). The design communicates operational standing at a glance.
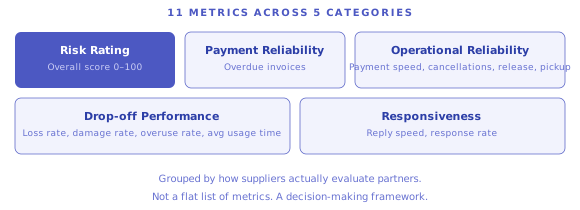
Decision 2: Grouping into Five Operational Categories I organized the 11 metrics into five functional groups matching supplier decision workflows: Risk Rating (composite corporate and financial score from 0 to 100), Payment Reliability (overdue invoice settlement rates), Operational Reliability (payment speed, cancellation rate, release speed, pickup speed), Drop-off Performance (loss rate, damage rate, overuse rate, average usage duration), and Responsiveness (reply speed, response rate).
Decision 3: Explicit Handling of Insufficient Data When a company lacked the required deal volume (fewer than 5 deals in 6 months), the system renders a structured “Not available” state with an “Insufficient data” indicator rather than hiding the row. Maintaining consistent component structure across all profiles preserved predictable spatial positioning and signaled platform standards to new participants.
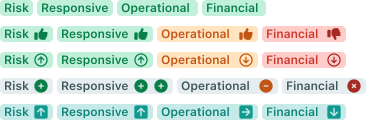
Decision 4: Contextual Display on Leasing Search Cards Leasing and trading workflows carry different risk profiles: leasing involves ongoing asset custody, while trading is transaction-settled. I introduced performance badges exclusively to leasing search cards, displaying verified status for Responsiveness, Financial Reliability, Operational Reliability, and Risk Score.
System & Pattern Thinking
I designed the performance widget as a modular component within the platform design system. Each metric follows a standardized layout: title label, definition tooltip, segmented indicator, absolute value, and descriptive summary.
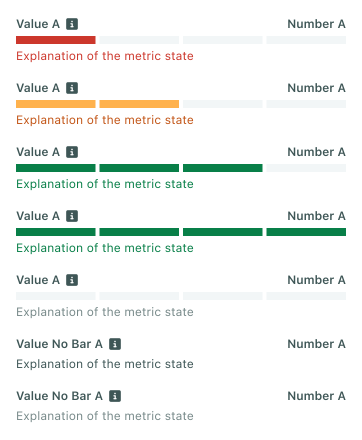
The component framework supports role-based permutations: pure suppliers display N/A for lessee metrics, hybrid operators show complete indicators, and new members maintain the predictable grid layout.
Solution
Overview
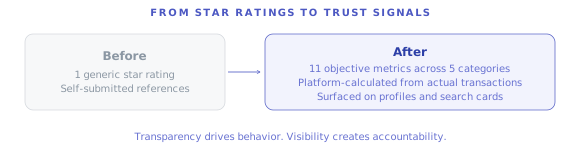
A comprehensive performance metrics and operational risk profile system integrated across company profiles and marketplace search listings. The release included 11 transaction-calculated metrics across 5 categories, explanatory tooltips, leasing search badges, a verified documents module, and an advance partner notification protocol.
Performance Widget on Company Profiles
The full metrics widget occupies a dedicated section on company profiles, presenting metrics grouped into logical operational categories. Tooltips disclose exact mathematical formulas and data windows for complete auditability.
Summary Ratings on Leasing Search Cards
High-level badges (“Very Responsive”, “Very Reliable”, “Low Risk”) surface directly on search cards in the leasing marketplace. Exposing operational ratings at the search stage allows suppliers to filter and evaluate partners before initiating negotiations.

Transparent Data States
Each metric supports five distinct visual states: four performance bands and an explicit “Insufficient data” state. Metrics require 3 deals for risk scores and 5 deals for operational indicators over a rolling 6-month window.
Verified Documents Section
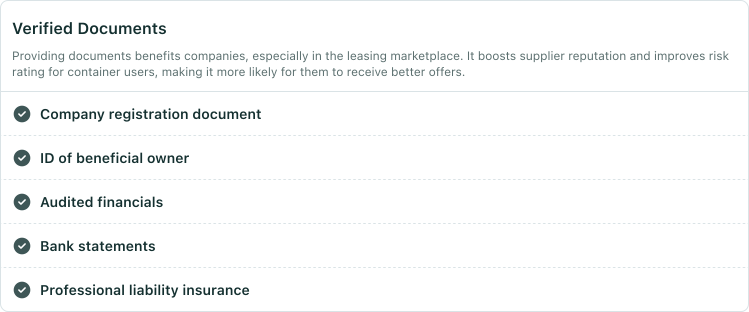
Alongside transaction metrics, I designed a verified documents component indicating submission status for corporate registration, executive identification, audited financials, bank statements, and liability insurance.
Interaction Details
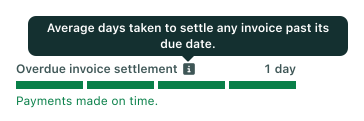
Contextual tooltips explain calculation methodologies on demand, maintaining a clean default layout while providing complete transparency.
Cross-Platform Considerations
The performance architecture maintains a consistent interface across different operational roles on the platform, establishing standardized metrics for all marketplace participants.
Implementation & Iteration
MVP & Phasing Strategy
We prioritized the full 11-metric integration for the leasing marketplace, calibrating distribution models against live database records prior to deployment.
MVP objectives:
- Validate calculation models: Verify metric distributions across the entire customer database, ensuring accurate tier assignments.
- Deploy the complete profile experience: Release the 11 metrics, 5 categories, and verified compliance documents widget on company profiles.
- Integrate search badges: Surface high-level trust badges on leasing search listings to accelerate partner evaluations.
Pre-Launch Communication
We executed an advance notification campaign to companies in high and moderate risk tiers prior to public release. This gave underperforming partners a clear window to resolve open disputes or upload verification documents, initiating operational improvements before ratings became public.
Collaboration & Handoff
Account management and risk teams defined domain logic and operational categories. I led product design: defining metric architecture, visual components, interaction states, and design system documentation. Engineering implemented the backend calculation pipelines and front-end components from these specifications.
Post-Launch Iteration
Following deployment, multiple underperforming companies contacted account management to understand specific metric calculations and improve their ratings. The response confirmed that publishing objective performance data created direct incentives for operational improvement.
We migrated the subjective reviews section to a secondary tab to prioritize objective performance data on the primary profile.
Outcomes & Impact
| Metric | Result |
|---|---|
| Marketplace transactions | Contributed to a 40% increase over 6 months (~10% estimated from improved supplier reliability) |
| Metric coverage | 11 objective metrics across 5 operational categories |
| Trust framework | Replaced subjective star ratings with multi-dimensional transaction data |
| Risk clarity baseline | 32% supplier satisfaction prior to launch |
| Search integration | Verified performance badges surfaced on leasing search cards |
| Behavioral response | Underperforming suppliers took proactive steps to resolve disputes |
Measurement context: Marketplace transaction volume grew 40% over six months, driven by inventory growth, matchmaking updates, and increased deal confidence from transparent supplier metrics. Risk transparency directly accounted for an estimated 10% of that expansion.
Publishing objective metrics altered partner selection dynamics. Suppliers demonstrated greater willingness to transact with new, unfamiliar partners when verified operational badges confirmed prompt payment and release histories.
Organizational Impact
The project established the first objective trust framework on Container xChange, transitioning the platform from an assumed dispute mediator to a transparent data provider. The metric schema provided a shared analytical baseline across product, risk operations, and account management teams.
Learnings
Surfacing objective operational data proved more effective than administrative enforcement. Publishing release speeds, payment timelines, and damage rates motivated suppliers to improve their performance voluntarily.
Partnering directly with account management and risk operations provided deep operational insights from existing dispute records. However, post-launch data revealed that new marketplace participants with sparse transaction histories experienced search disadvantages under strict “N/A” states. In future implementations, I would design a formal onboarding grace period directly into the MVP.
Modeling metric distributions against the complete production database prior to release was critical: live data testing prevented distorted scoring thresholds that could have penalized suppliers unfairly and constrained marketplace liquidity.